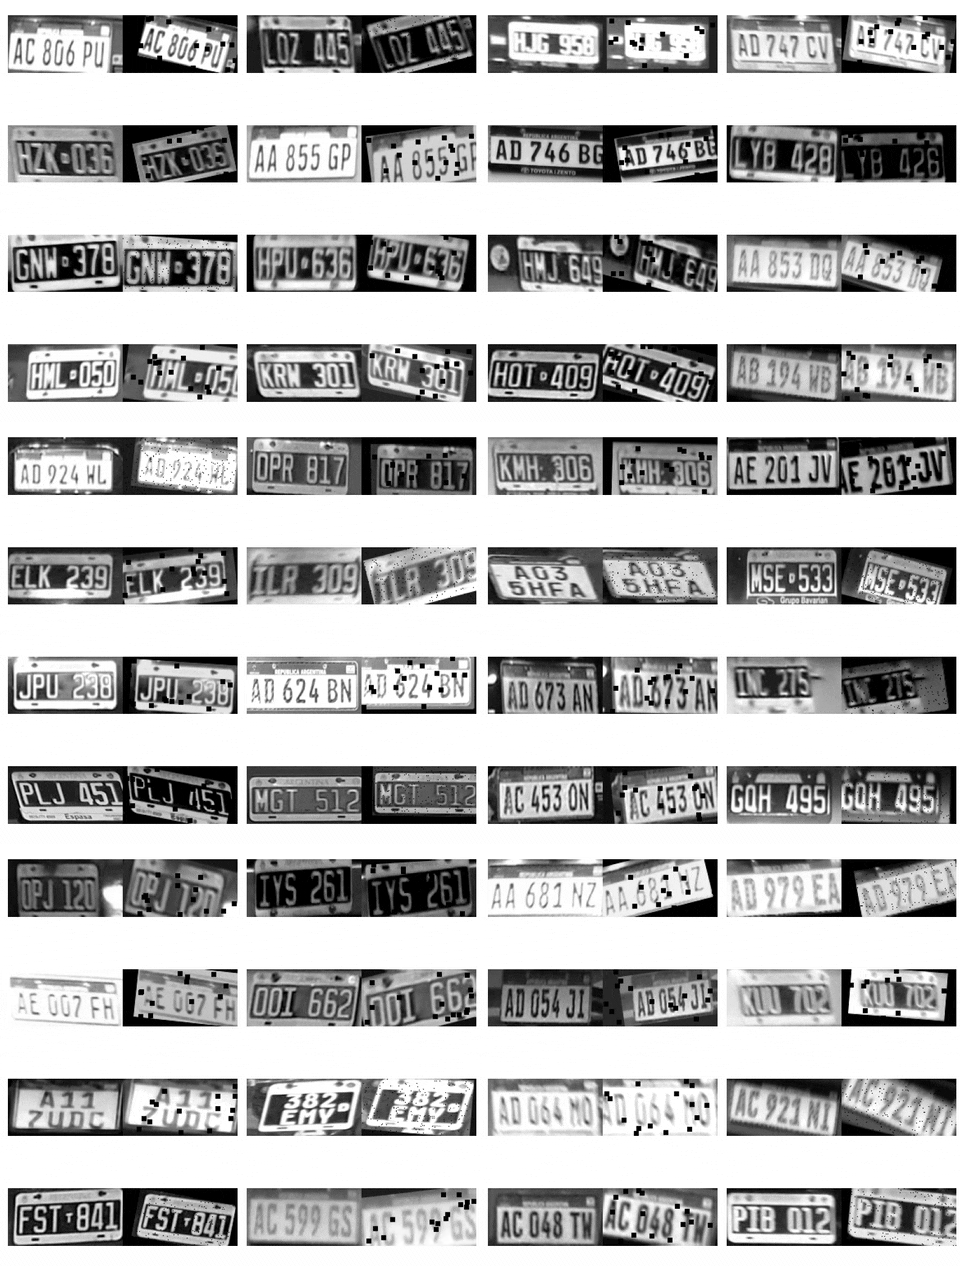
Visualize Augmentation
Before training, it's helpful to preview the effects of your augmentation pipeline. This visualize-augmentation
CLI script lets you quickly visualize how your images will look after transformation, giving you an intuitive sense of
whether the augmentations are too strong, too weak, or just right.
Image augmentations affect model generalization, so it's important to visually inspect them to ensure they're appropriate and realistic.
Example: Side-by-Side Comparison
fast-plate-ocr visualize-augmentation \
  --img-dir benchmark/imgs \
  --columns 2 \
  --rows 4 \
  --show-original \
  --augmentation-path transforms.yaml \
  --plate-config-file config/latin_plates.yaml
This shows 8 images (2x4 grid), each combining the original (left) and the augmented (right) version.

Default Augmentation
If --augmentation-path is not provided, the tool uses the default training pipeline from
fast_plate_ocr.train.data.augmentation.
RGB/Grayscale default augmentation
When using rgb in the plate config, the default augmentation applied is slightly different
than the one when choosing grayscale (it basically has more color/noise transforms).